Are You Beating the Market?
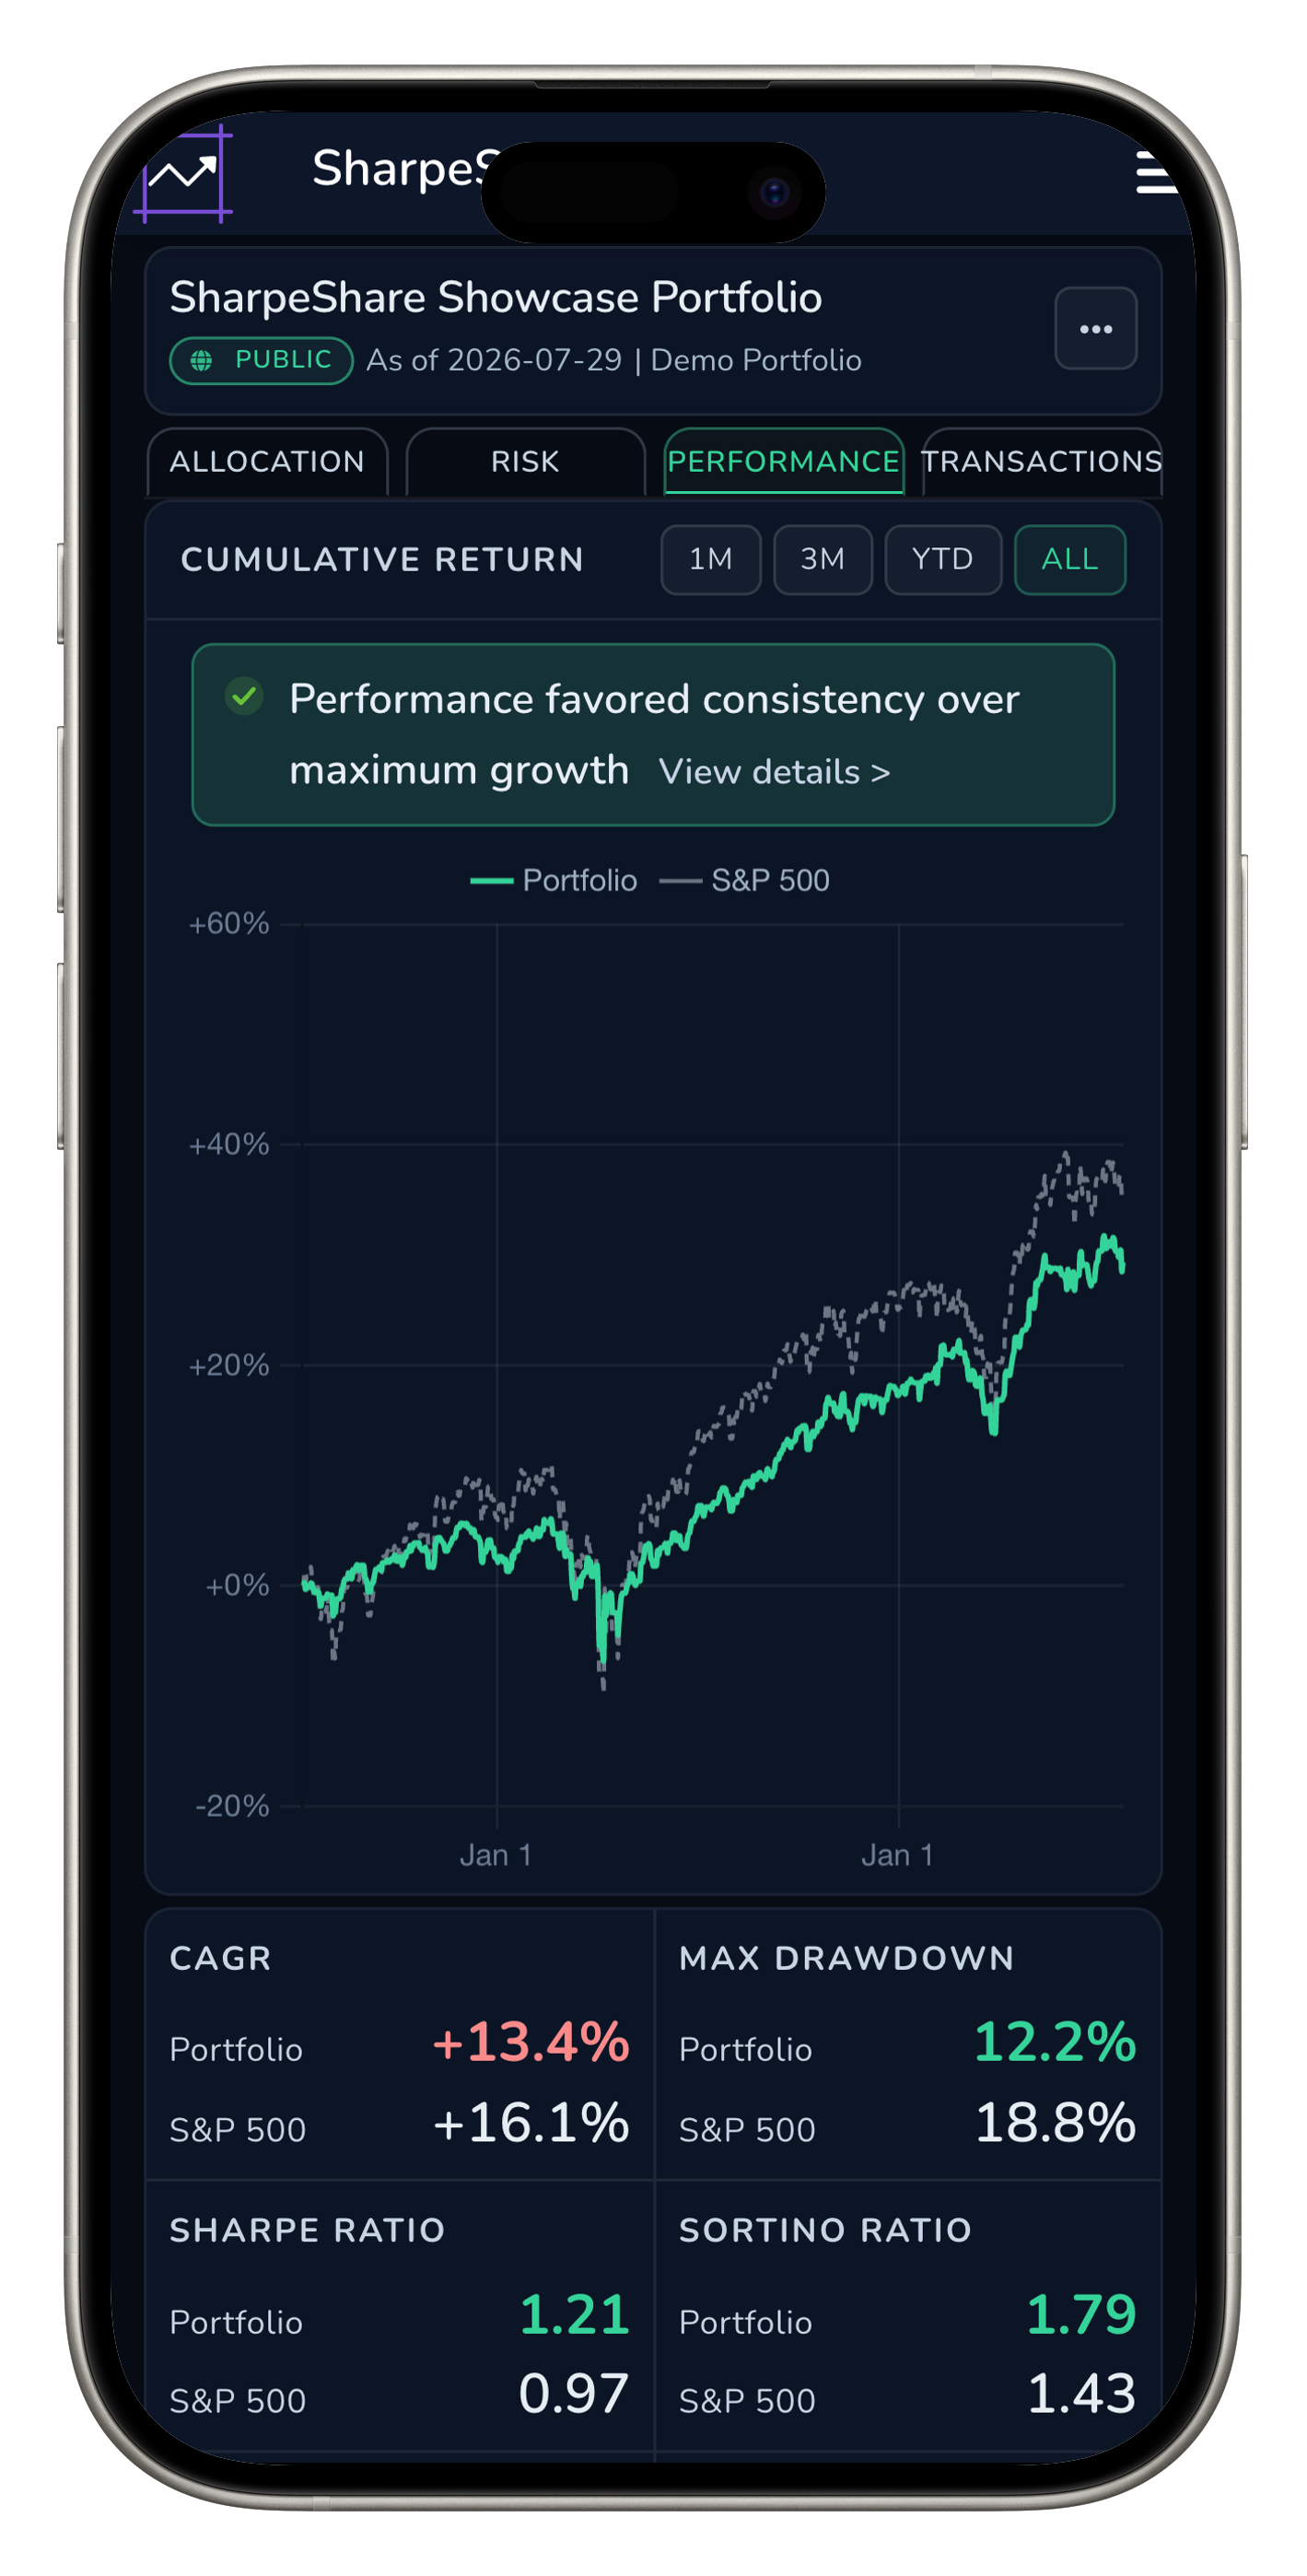
Your broker only shows your balance—not whether you're actually beating the market. SharpeShare automatically benchmarks your portfolio against the S&P 500 and calculates the metrics that matter—giving you the context your brokerage account is missing.
Are You Beating the Market?
Your broker only shows your balance—not whether you're actually beating the market.
SharpeShare automatically benchmarks your portfolio against the S&P 500 and calculates the metrics that matter—giving you the context your brokerage account is missing.
- Compare your portfolio against the S&P 500
- Professional metrics: CAGR, Sharpe, Sortino & Max Drawdown
- Automatically track your investing performance over time
Professional portfolio analytics without manual spreadsheets.
See the Story Behind Your Returns
SharpeShare automatically benchmarks your portfolio against the S&P 500 and calculates the metrics that matter, giving you the context your brokerage account is missing.
- See your annualized return over any time period
- Understand risk-adjusted performance, not just raw gains
- Follow your performance history without spreadsheets
- Spot drawdowns and recoveries as they happen
Portfolio Performance
Similar Returns Can Hide Very Different Risk
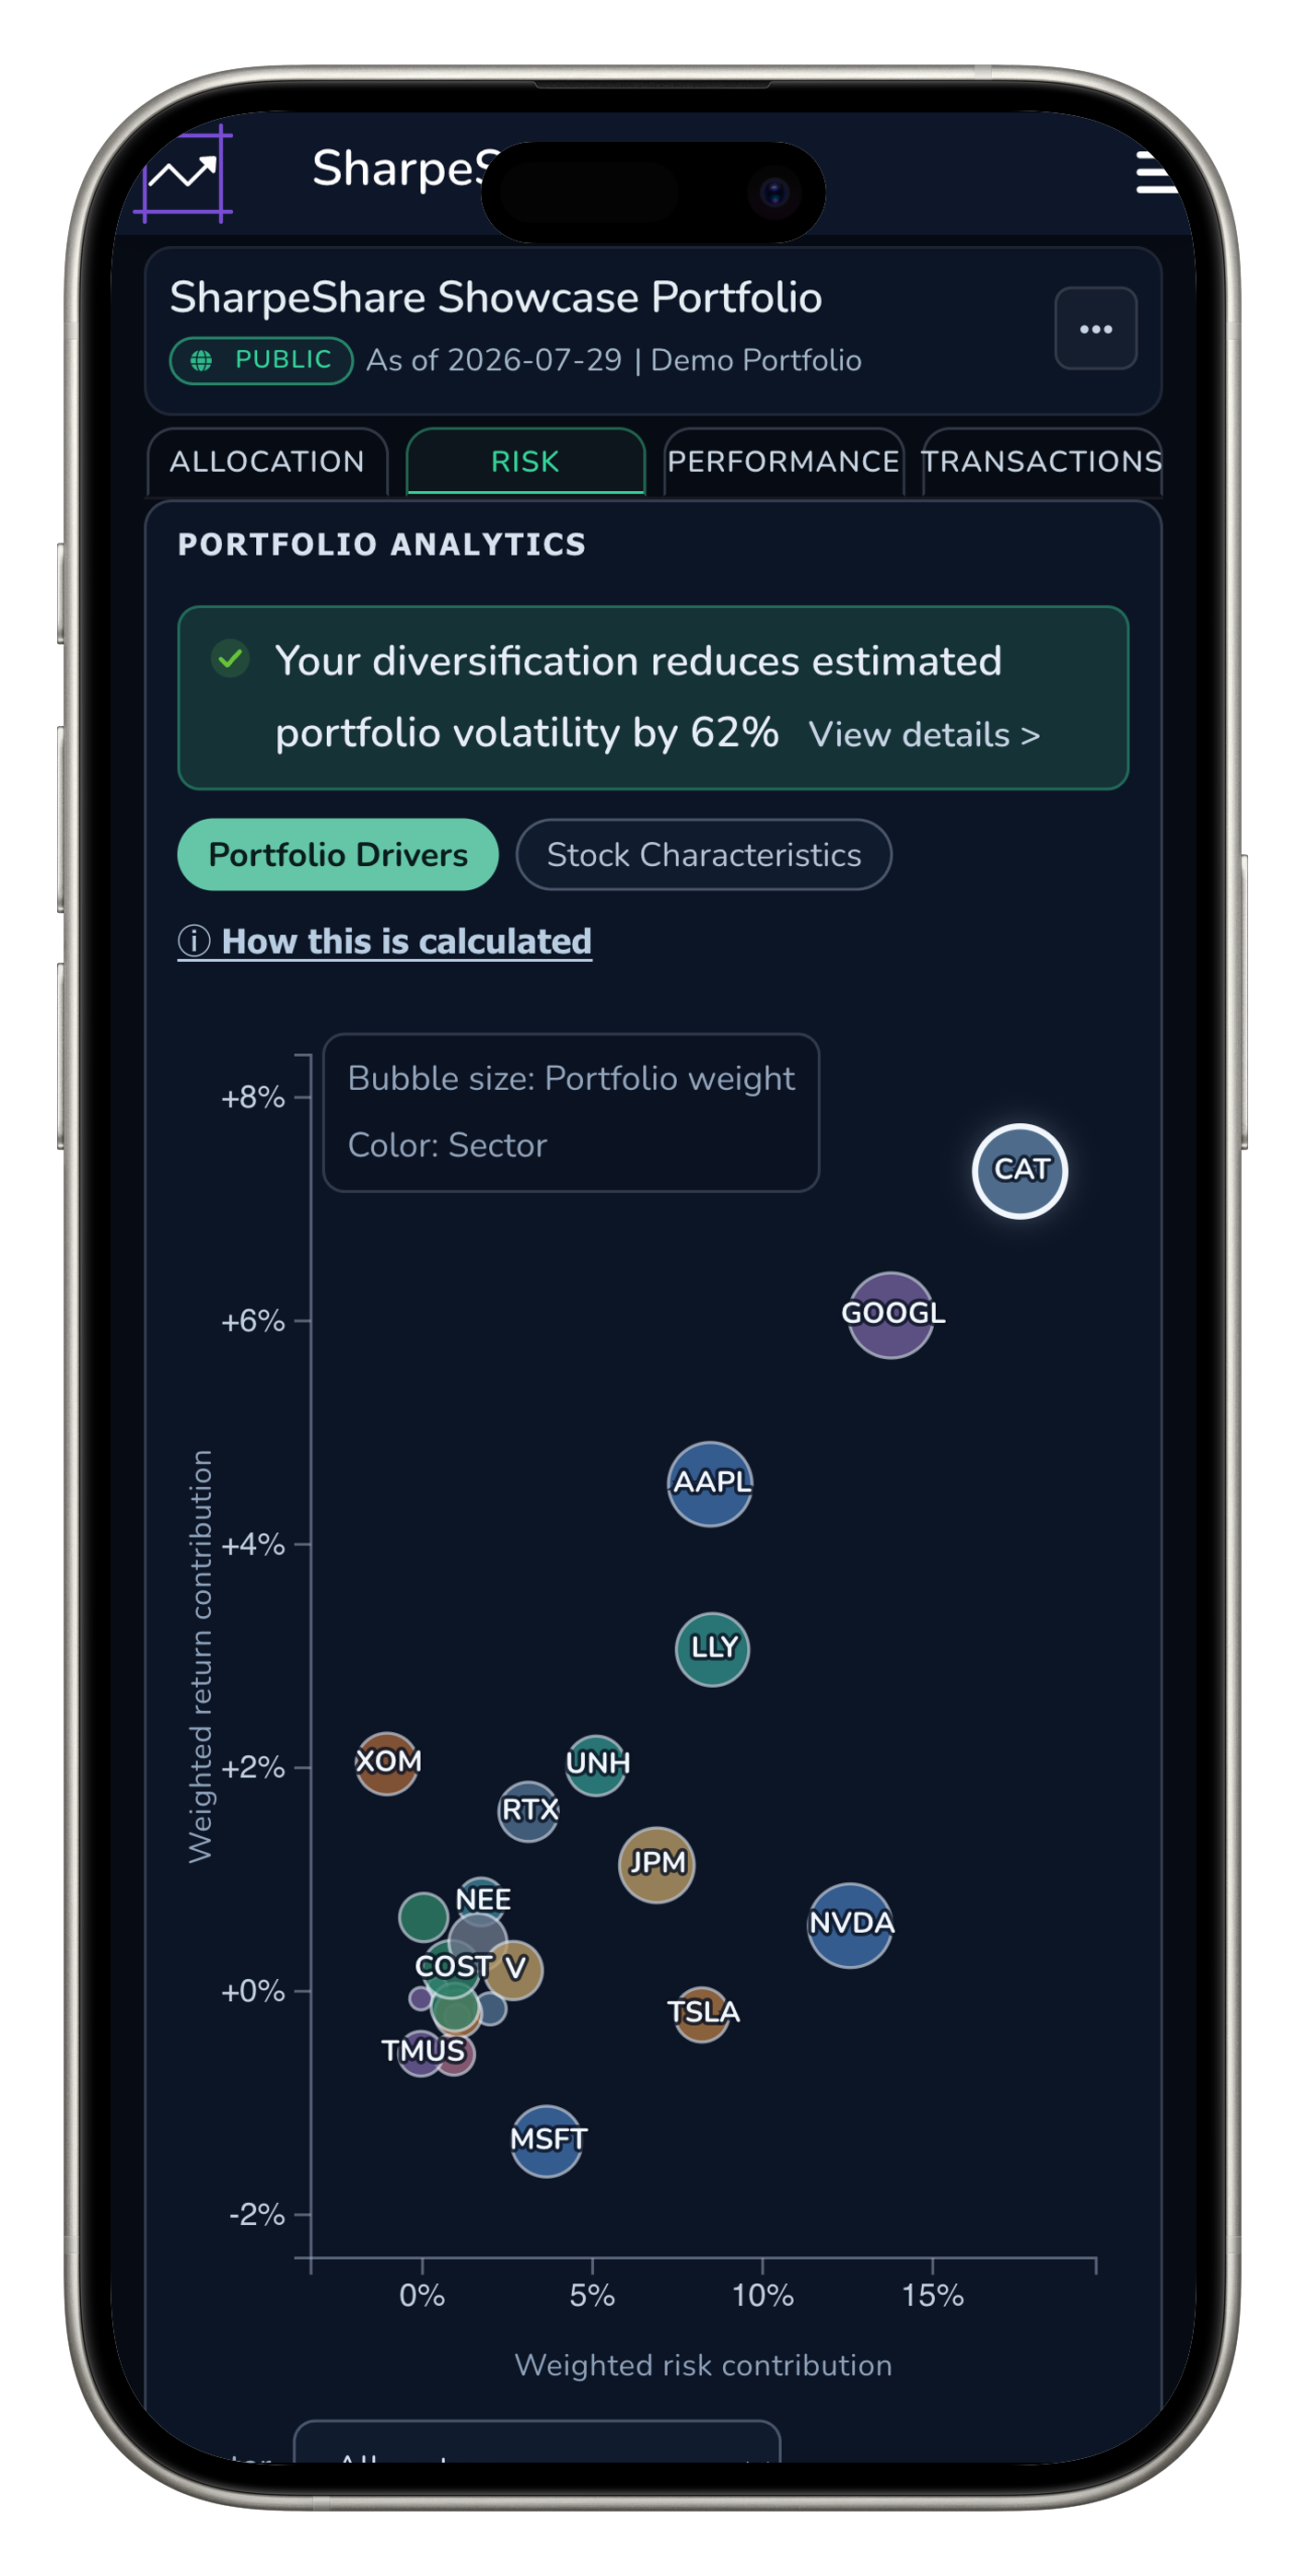
Returns only tell part of the story. Two portfolios can post the same gain while taking very different levels of risk to get there.
SharpeShare pairs your performance with volatility, drawdown, and concentration data, so you can tell whether strong returns reflect skill or just extra risk.
Portfolio Risk Map
Check Your Exposure, Not Just Your Returns
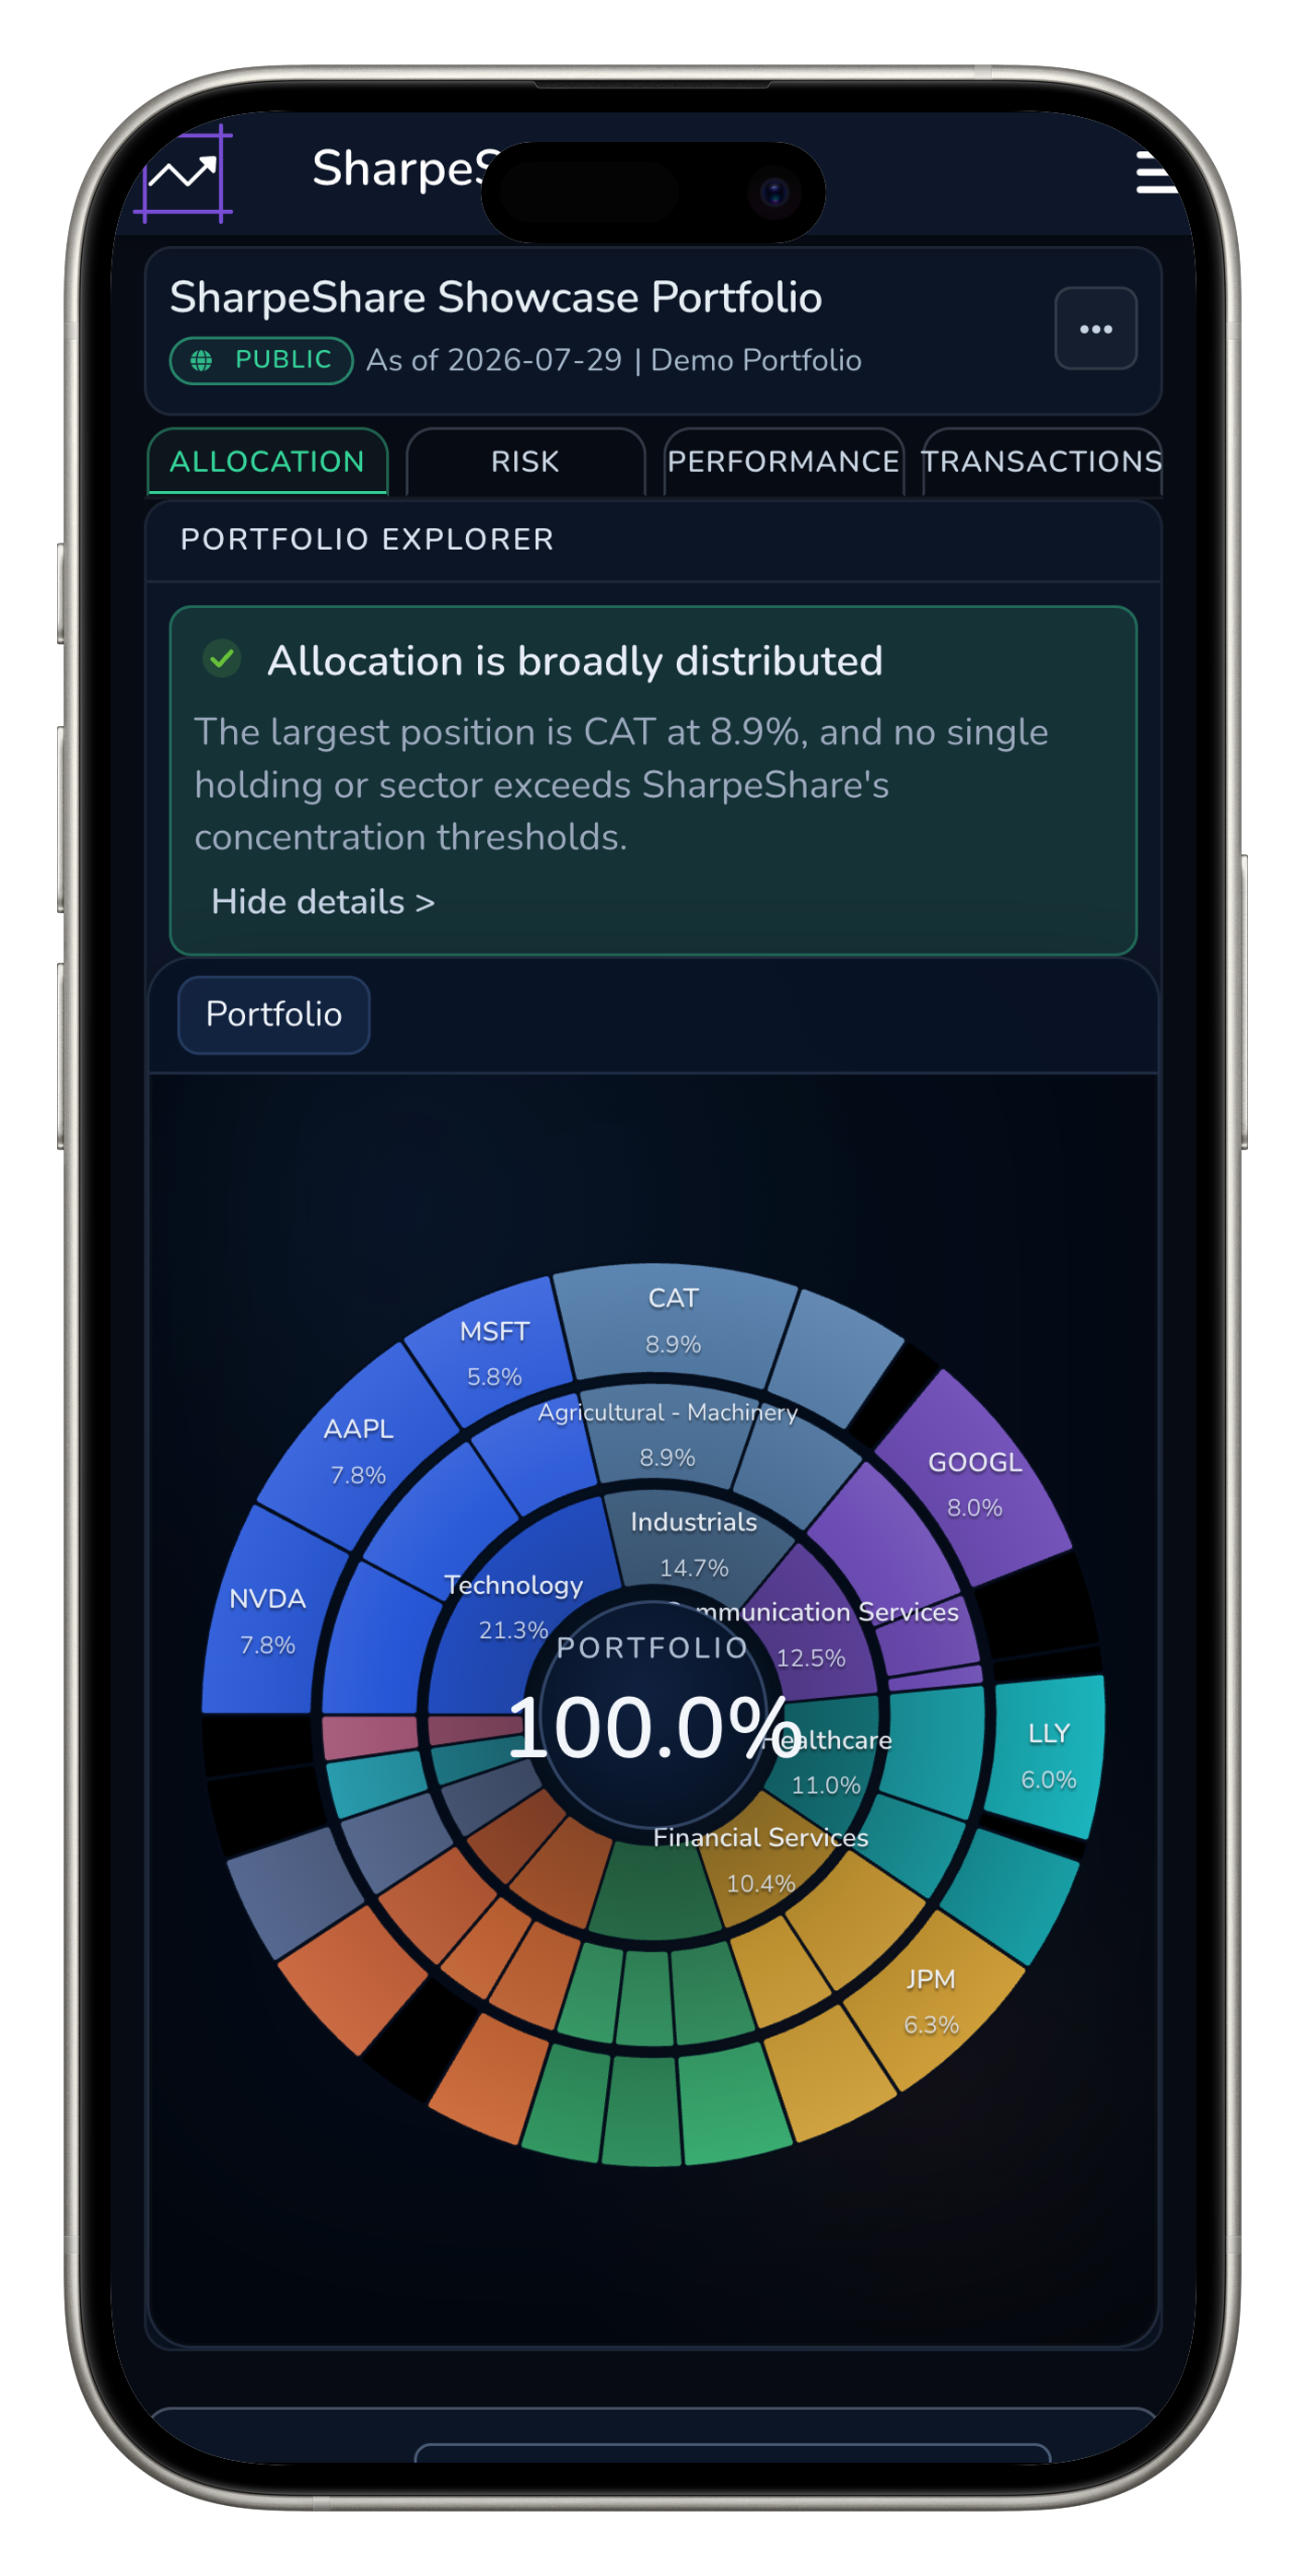
Strong performance can still hide a concentrated, undiversified portfolio. See your sector and holding-level exposure to know what is really behind the numbers.
- See exposure by sector
- Drill into industry exposure
- Spot company concentration
- Surface your largest positions
Portfolio Explorer
Broker-Connected Performance Tracking
Connect your broker securely through Plaid so SharpeShare can analyze verified portfolio performance using read-only access. Your brokerage credentials are never stored.
- Encrypted broker connection through Plaid.
- Read-only access means SharpeShare cannot place trades or move funds.
- Your portfolio stays private unless you choose to share it.
Connect securely through Plaid
Read-only connections. Your funds stay at your broker.







How It Works
Three steps. No spreadsheets.
Connect Your Broker
Securely link a supported account with read-only access.
Analyze Performance
SharpeShare benchmarks your portfolio against the S&P 500 and calculates the performance metrics that matter.
Improve Investment Decisions
Review benchmark comparisons, historical performance, and risk-adjusted metrics to better evaluate your investing strategy.
See How Your Portfolio Really Performs
Connect your broker to compare against the S&P 500, measure risk-adjusted returns, and start tracking your performance automatically.
No credit card required.