Owning More Stocks Doesn't Mean You're Diversified.
Diversification isn't about the number of stocks you own. SharpeShare reveals your true allocation across sectors, industries, and holdings so you can spot hidden concentration at a glance.
Owning More Stocks Doesn't Mean You're Diversified.
Diversification isn't about the number of stocks you own.
SharpeShare reveals your true allocation across sectors, industries, and holdings so you can spot hidden concentration at a glance.
- See your true allocation across sectors and industries
- Find hidden concentration despite owning many stocks
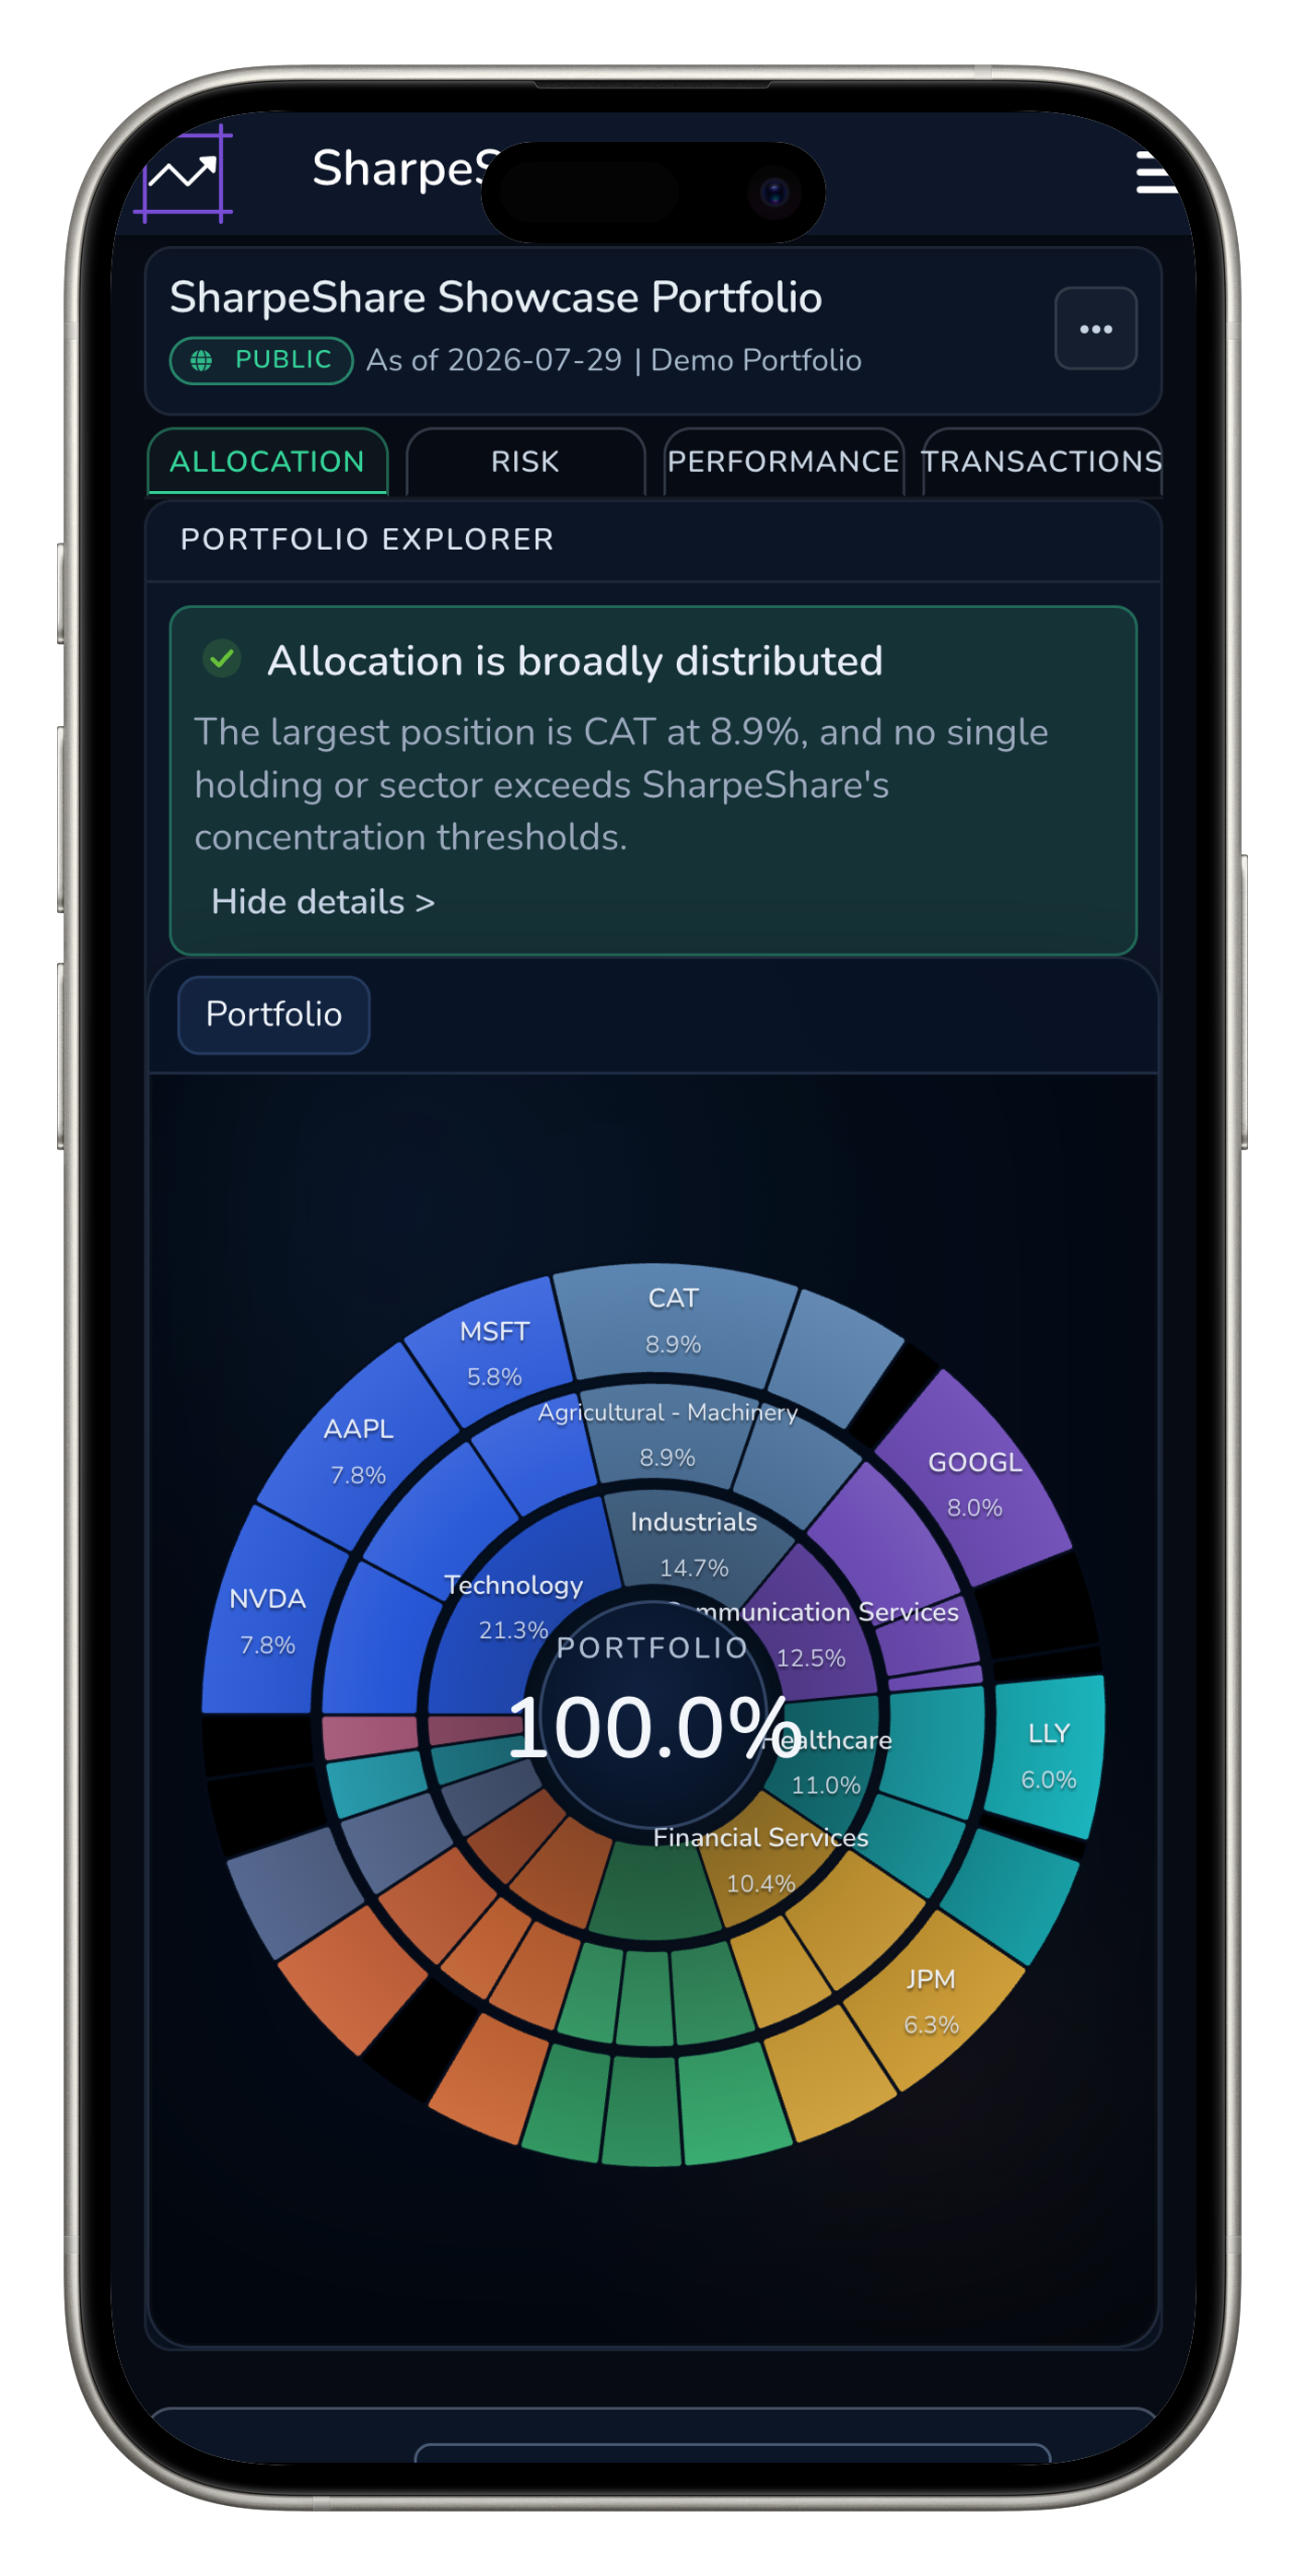
- Explore an interactive portfolio allocation visualization
- Spot opportunities to reduce concentration
Free trial. No spreadsheets. No manual tracking.
Check Your Exposure, Not Just Your Returns
Even strong returns can hide a concentrated portfolio. Explore your sector, industry, and company exposure to see what's really driving your investments.
- Visualize your portfolio allocation
- Break down sectors, industries, and holdings
- Catch concentration you didn't expect
- Identify your largest positions
Portfolio Explorer
Hidden Concentration Can Exist Anywhere
It's easy to assume that owning more stocks automatically spreads out your risk.
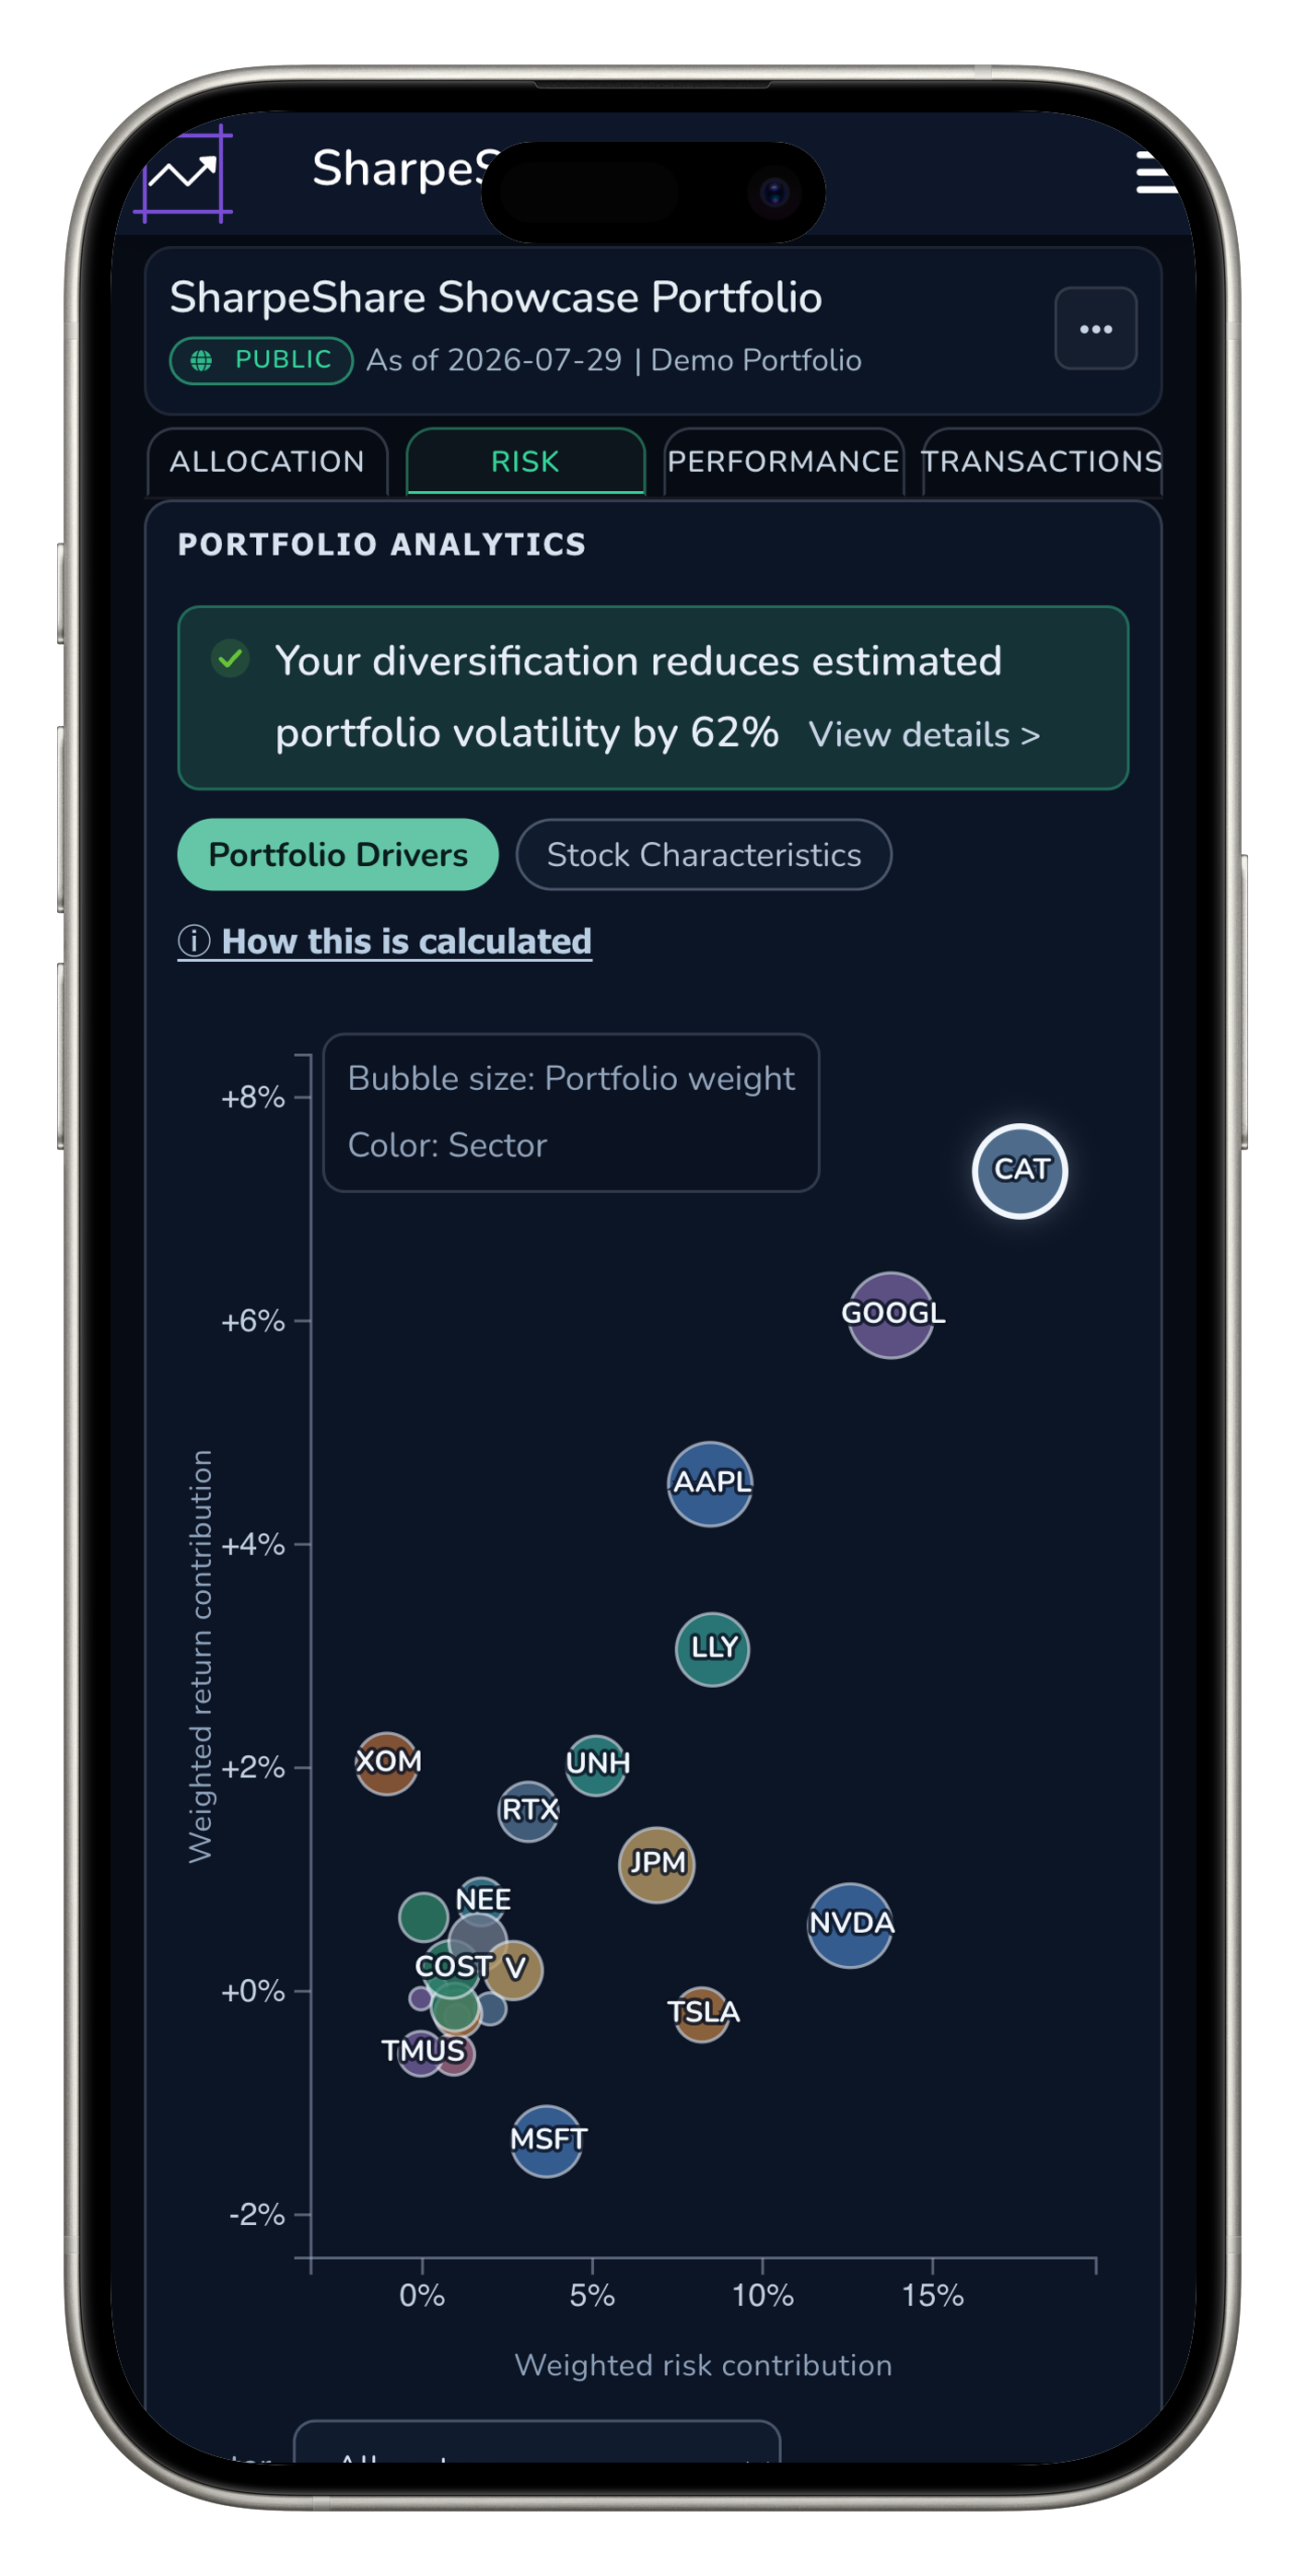
In reality, holdings that move together can cancel out that benefit and leave you more exposed than you realize. SharpeShare measures how your holdings actually interact, revealing whether your risk is truly diversified.
Portfolio Risk Map
See How Diversification Impacts Performance
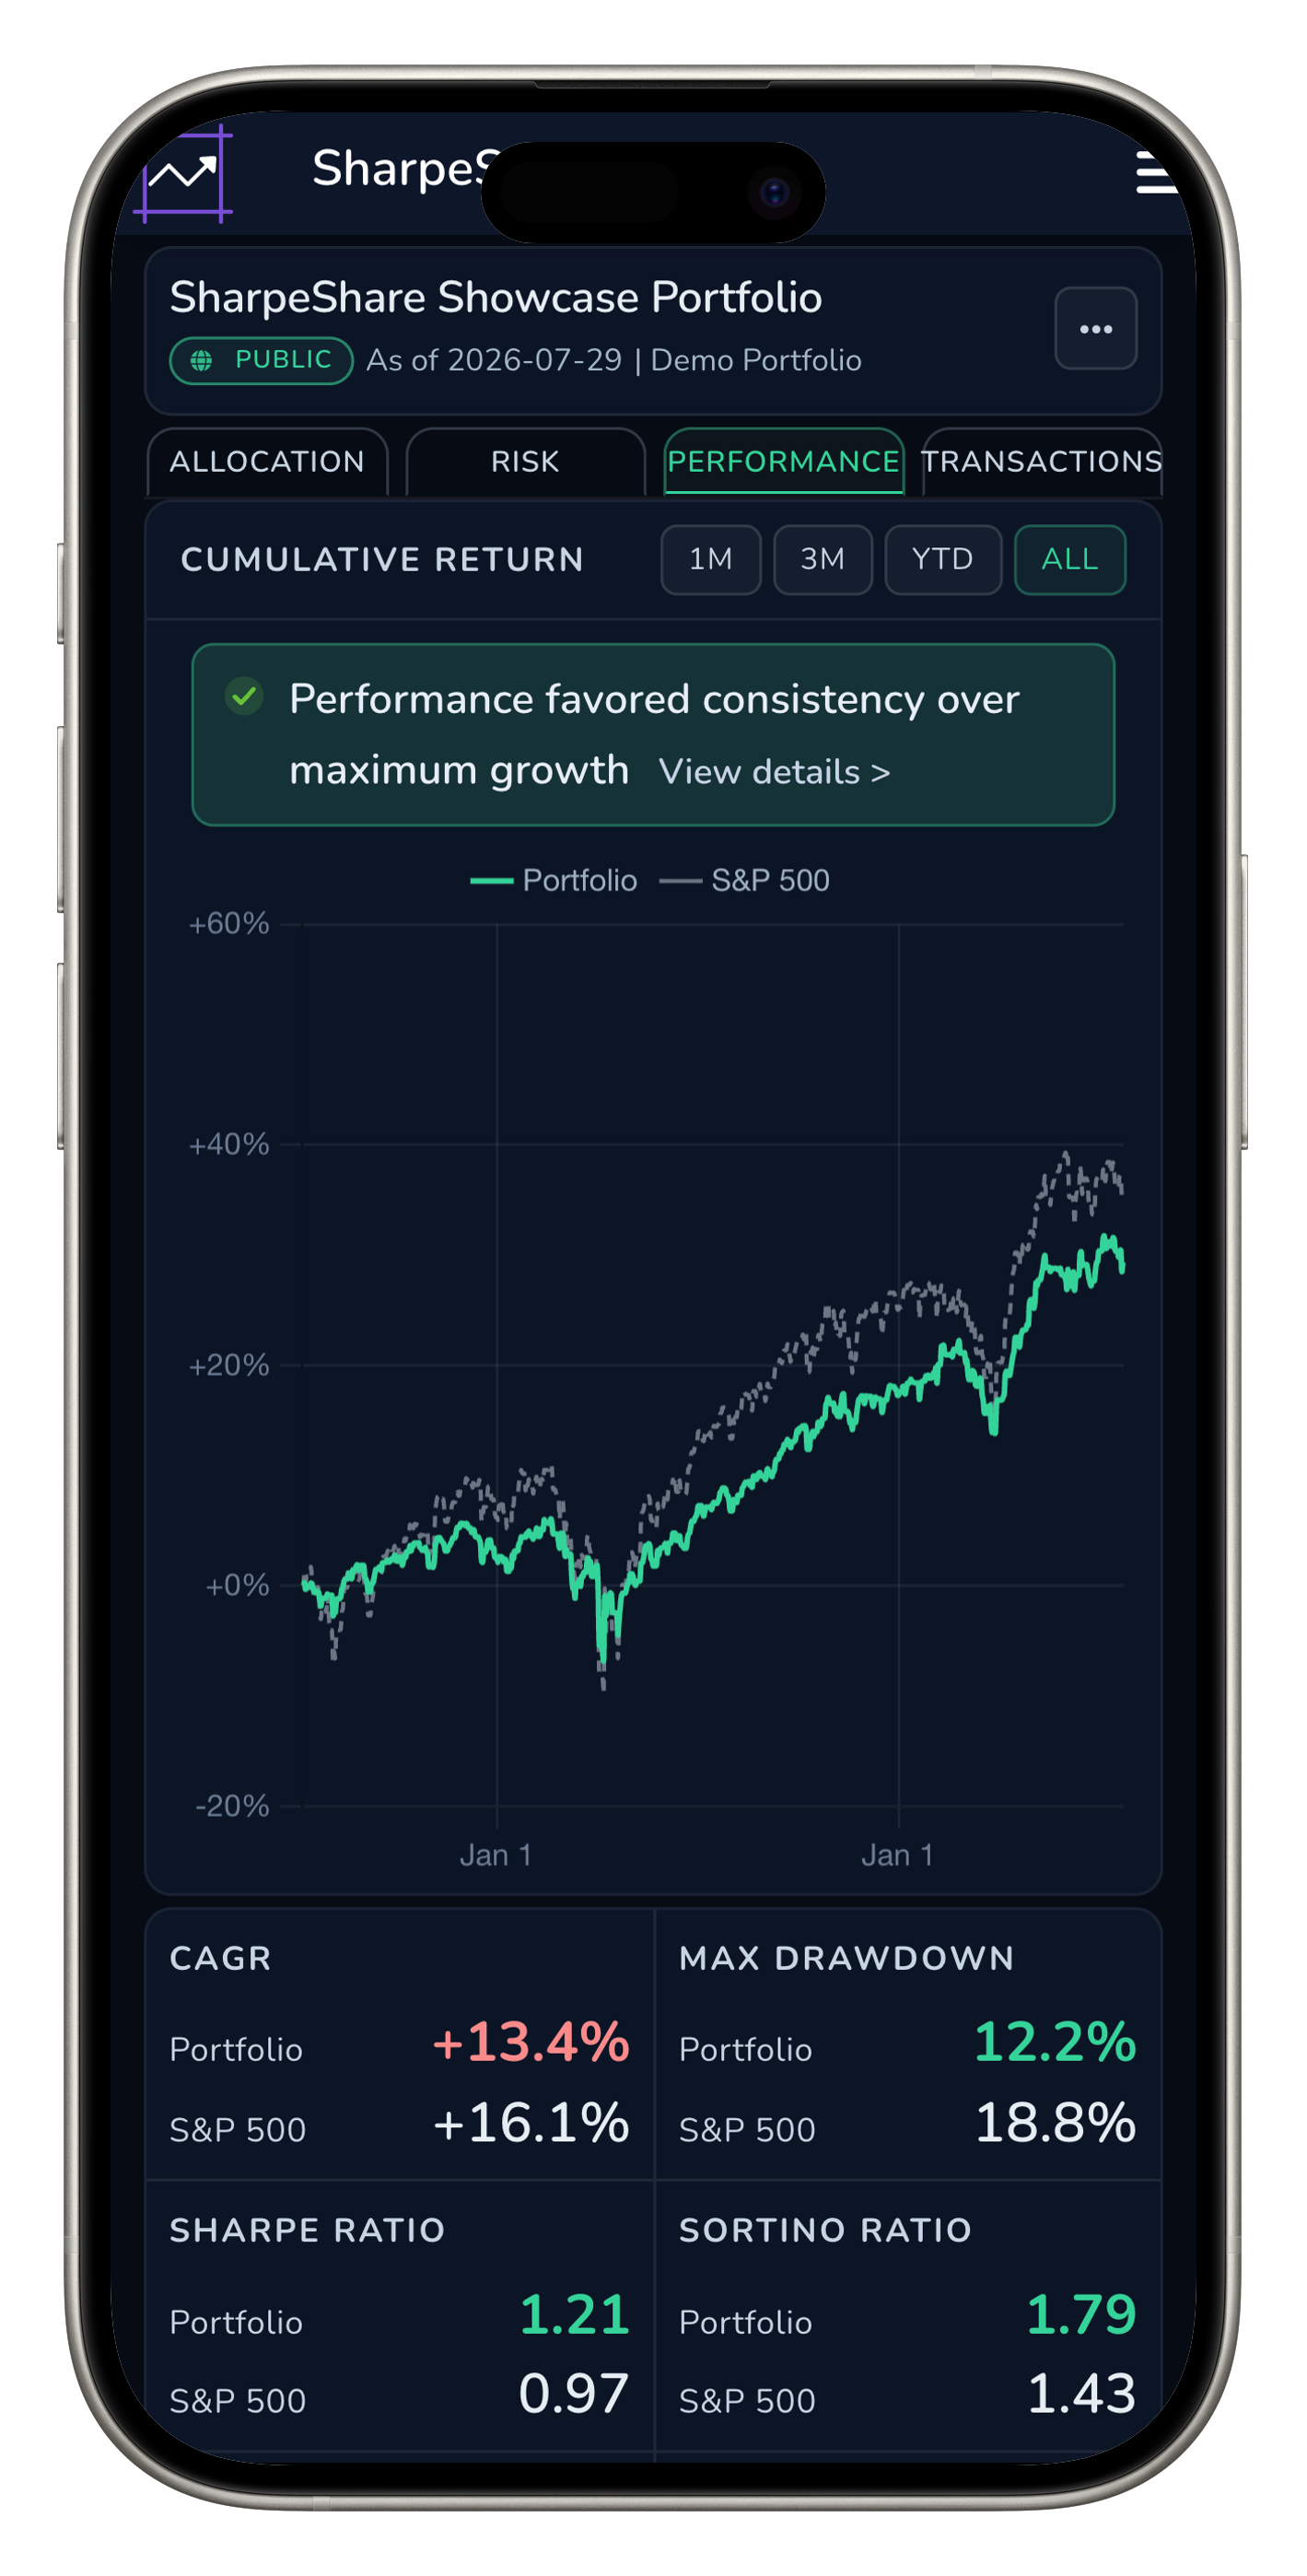
Diversification isn't the goal—better long-term investing is. Compare your portfolio's diversification alongside benchmark performance to see whether your allocation is helping over time.
- Benchmark your portfolio against the S&P 500
- Measure performance with CAGR, Sharpe, Sortino & Max Drawdown
- Track your investing performance over time
- No spreadsheets or manual calculations
Portfolio Performance
Broker-Connected Diversification Analysis
Connect your broker securely through Plaid so SharpeShare can analyze your portfolio allocation and diversification using your real holdings. Your brokerage credentials are never stored.
- Encrypted broker connection through Plaid.
- Read-only access means SharpeShare cannot place trades or move funds.
- Your portfolio stays private unless you choose to share it.
Connect securely through Plaid
Read-only connections. Your funds stay at your broker.








How It Works
Three steps. No spreadsheets.
Connect Your Broker
Securely import holdings and portfolio history through Plaid.
Analyze Diversification
SharpeShare visualizes your portfolio across sectors, industries, and holdings to reveal your true diversification.
Improve Allocation Decisions
Use diversification insights to identify concentration and make more balanced portfolio decisions.
Discover Your True Diversification
Connect your broker to uncover hidden concentration, explore sector exposure, and measure your portfolio's diversification.
No credit card required.