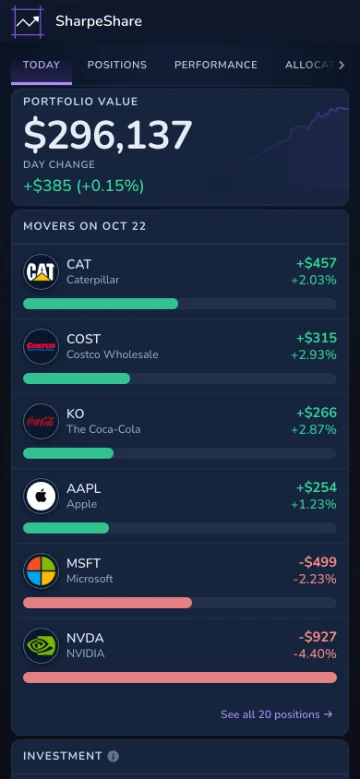
I've always noticed it, most recently in my broker's app. Its home screen shows the total value and a one-year change, and that change includes my deposits. So it's not growth. Nothing on the screen explains what the number is. Once I started picking stocks, it didn't answer the question I actually had: how do my picks compare with the overall market? I couldn't even see my own growth: what my choices earned, apart from the deposits and withdrawals I made for personal reasons. So the question stuck with me: why isn't this easy to see?
How do you calculate a return with deposits and withdrawals?
You want to know how much your account is growing. If you have $1,000 in your account and next week it grows by 1%, you get $10 of growth. That's simple math. Now say you deposit $500 in the middle of the week. Your balance is up about 51%, but your return isn't 51%. That $500 didn't grow; it just moved over from another account.
What you really want to know is whether your money is working for you. So you look at how much the $1,000 grew before the deposit, then how much the whole account grew after it: two time buckets.
That is what a time-weighted return does. It measures the first part on $1,000 and the second on $1,504.99, the value right after the deposit, then compounds the two.
| One week, $500 added mid-week | Value |
|---|---|
| Start | $1,000.00 |
| Mid-week, before the deposit | $1,004.99 |
| After the $500 deposit | $1,504.99 |
| End of the week | $1,512.49 |
| Balance change | +51.2% |
| Dollars the investments earned | $12.49 |
| Time-weighted return | +1.0% |
Of the 51.2% balance change, 50 points are the $500 deposit itself; the investments earned $12.49, a 1.0% time-weighted return.
Example

Example

The total is useful, but it doesn't answer the growth question.
Why can I be up in dollars but down in percent?
In the table below, the dollar figure is the account's value minus the money put in. A time-weighted rate of return measures how the investments did; a money-weighted one also counts when the money arrived. So the same prices can give a dollar gain next to a negative time-weighted return.
| The same two moves in opposite order, a $10,000 deposit between them | Deposit before the drop | Deposit before the rise |
|---|---|---|
| Start | $10,000 | $10,000 |
| First period | +10% → $11,000 | −10% → $9,000 |
| $10,000 deposit | $21,000 | $19,000 |
| Second period | −10% → $18,900 | +10% → $20,900 |
| Dollars (value minus the $20,000 put in) | −$1,100 | +$900 |
| Time-weighted return | −1.0% | −1.0% |
| Money-weighted return, both periods | −7.3% | +6.0% |
In both columns the investments rose 10% and fell 10%, in opposite order, which compounds to −1.0% either way. What changed is whether the $10,000 arrived before the drop or before the rise, and that moved the dollar result and the money-weighted return the same way.
Personal vs investment rate of return: what's the difference?
- Time-weighted (Fidelity calls it the Investment Rate of Return): takes out the effect of the money you move in and out, so it shows how the investments themselves did.
- Money-weighted (Fidelity's Personal Rate of Return): counts the timing and size of your deposits and withdrawals, so it shows how your dollars did.
Both can be correct for the same account. They answer different questions.
Which number is my broker showing?
Brokers label these figures differently, and not every help page names the method:
- Fidelity shows both rates, labelled Personal and Investment.
- Robinhood says its portfolio chart leaves deposits, withdrawals and transfers out of the return ("returns reflect only investment performance"). A stock's "Total return" is its market price minus your average cost, times your shares.
- Schwab's Portfolio Performance shows "value vs. net contributions and rate of return" and lets you compare with indexes; schwab.com doesn't name the method.
- Interactive Brokers' PortfolioAnalyst offers both, a time-weighted and a money-weighted return, with a toggle.
If your app says plainly that it shows a time-weighted return, that's great.
Open your brokerage app and find a day you made a deposit or a withdrawal. If the chart jumps that day and nothing explains how the number is computed (whether it accounts for money moving in or out, or is a time-weighted return), that might be a clue it's showing your balance. A balance is important, but it isn't as useful for answering questions like: am I outperforming the market? Am I choosing well?
Which number compares fairly with the S&P 500?
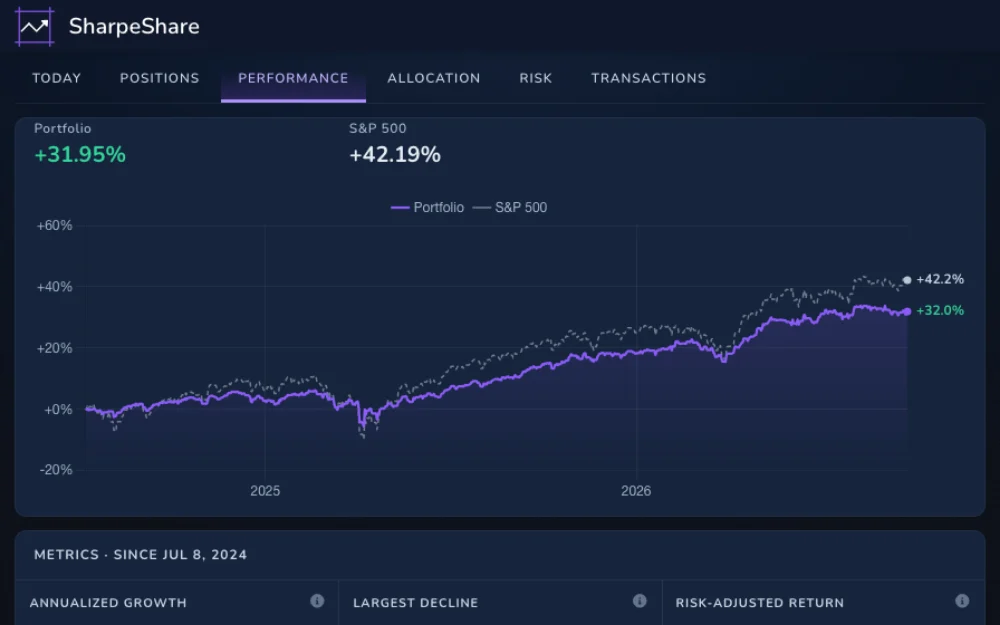
The time-weighted return. It separates the money you move in and out from how your investments performed, which makes it a fair comparison with the S&P 500. A fund's reported return likewise assumes one lump sum held for the whole period, with no deposits.
In the end, I want to know whether my investment decisions are sound. Without a time-weighted return, I can't compare my results apples to apples with the S&P 500. For all I know, my investments could be doing poorly on risk, reward or both.
Other reasons the numbers can differ
- Different dates. A one-year figure, a year-to-date figure and an all-time figure measure different windows.
- Trade date vs settlement date. Fidelity's performance figures use trade date and its statements use settlement date.
- Dividends. Whether they count as return, and whether the S&P 500 figure includes them. Cost basis rises when dividends are reinvested, so cost basis isn't a performance measure.
- One holding vs the whole portfolio. A holding's gain against its average cost is not the portfolio's rate of return.
- Live prices vs closing prices. A return built from daily closes moves less often than a live balance.
See it in the Demo: the Performance tab of the Demo Portfolio.